
Location data is an important category of data that you frequently have to deal with in many machine learning applications. Location data typically provides a lot of extra context to your application’s data.
For instance, you might want to predict e-commerce sales projections based on your customer data. The machine learning model might be able to identify more accurate customer buying patterns by also accounting for the customer location information. This would become all the more important if this was for a physical site (rather than online) such as retail stores, restaurants, hotels, or hospitals.
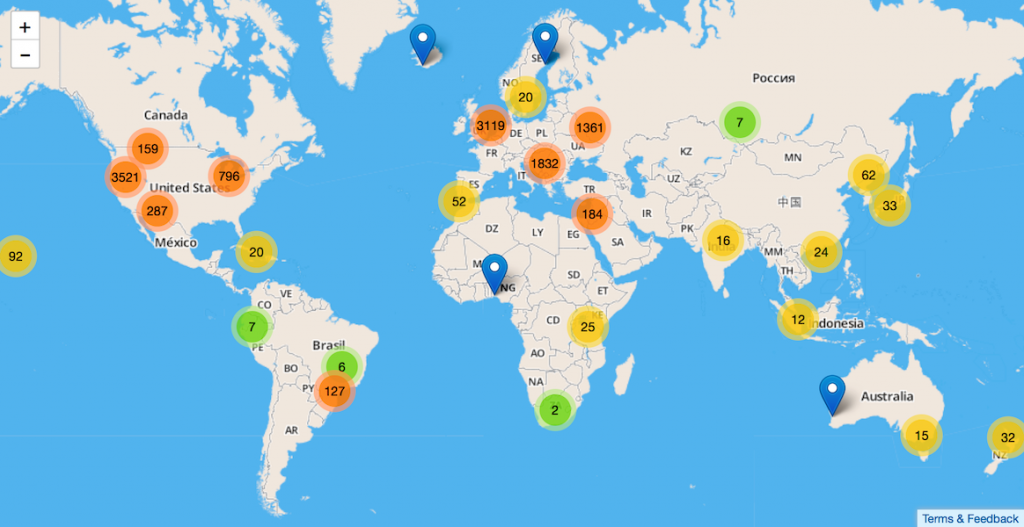 Geolocation data can be applied to a range of use cases (Source)
In this article, my goal is to provide an overview of dealing with geolocation data for machine learning applications. This is a vast subject so I will try to give you a flavor of the issues involved. In future articles, I hope to dive deeper into some of those specific areas.
Application Domain data (includes basic location information)
As with all machine learning applications, we start with a dataset about the application domain. The key is that it also contains information to identify a physical location of interest, either in the form of an address or as geographical coordinates like latitude and longitude.
Let’s say that we were trying to predict real estate prices. Our dataset would normally consist of information about the house (its type, age, square footage, and so on), its price, and of course, its location. This is structured tabular data.
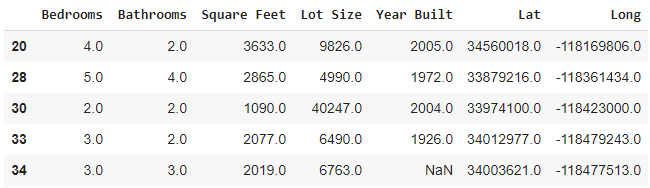 (Image by Author)
Other applications might use other types of data as well, like images for example. We might use satellite imagery to make predictions for applications like agriculture (eg. forecast food output), geology (eg. best mining location) and so on.
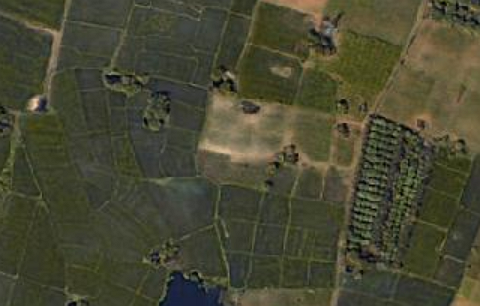 Satellite Images (Image by Author)
Clearly, the location plays a big factor in determining these predictions. How can we leverage that?
Geospatial data (used to augment location information)
We could augment our dataset by adding external location-based data (either publicly available or from a third party). I’ll use the term “geospatial data” or “GIS data” to describe this because it includes information related to the geographical context of the location.
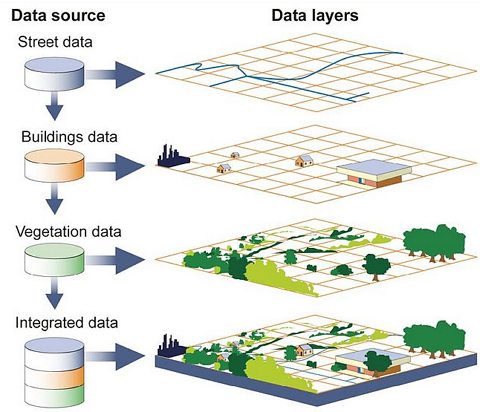 Geospatial data capture essential geographical attributes of the location (Source)
For our real estate application, this might be neighborhood information, locations of schools and parks, city administrative boundaries, population density, earthquake or flood zones, and any number of such factors.
Similarly, for our satellite application, this could include locations of rivers and forests, topography such as hills and valleys, regional climate data, and so on.
Let’s first look at how this data is represented.
Geospatial data formats
There are a number of standard formats. They store geometry data along with other descriptive attributes about geographical entities. For instance, they could store route coordinates for roads along with the road surface, width, speed limit, type (city street, highway, etc).
Some of the most commonly used formats are:
- Shapefile (oldest and most widely used standard. A single ‘shapefile’ actually consists of a set of files - one file stores geometry data, another file stores custom data attributes, etc)
- GeoPackage (newer spec that is gaining popularity. Captures data in a single lightweight SQLLite database file with multiple layers)
- GeoJSON (uses standard text-based JSON format)
Geospatial Datatypes
Geo geometry data is stored as Vector objects such as:
- Point eg. buildings, houses, restaurants, pickup locations
- Line eg. streets, rivers, railway lines
- Polygon: Could contain holes eg. regions, districts, lakes, states, countries
- Multi Polygon: Collection of Polygons.
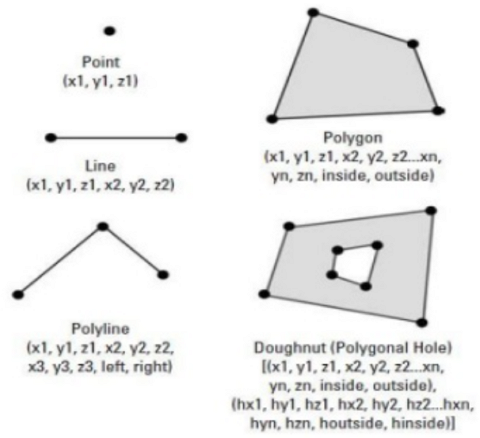 Geodata uses data structures like Point, Line, and Polygon (Source, by permission of Yousuf Gazi)
Besides storing these individual objects in isolation, geo data could also represent topology, which is the relationship between these objects. They define additional objects such as:
- Arc: similar to a line
- Node: an intersection point between different arcs or polygons
- Vertex: a bend in a line
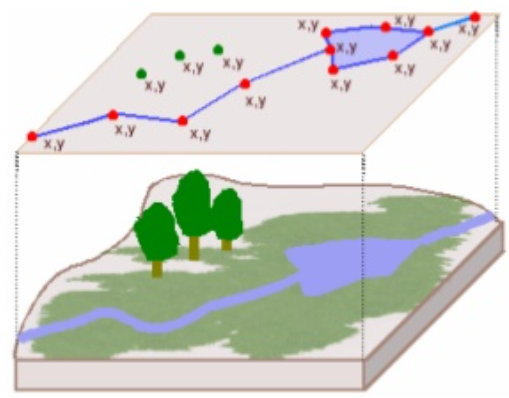 Geo objects represent geographical features and the relationships between them (Source, by permission of Yousuf Gazi)
They use data structures that capture the relationship between these objects such as:
- Which objects are next to each other?
- Which arcs connect to each other?
- Which objects are within other polygons?
Loading geodata
Fortunately, we don’t have to worry about parsing these different formats and manipulating low-level data structures.
We can use the wonderful GeoPandas library in Python that makes all this very easy for us. It is built on top of Pandas, so all of the powerful features of Pandas are already available to you.
It works with GeoDataFrames and GeoSeries which are “spatially-aware” versions of Pandas DataFrames and Series objects. It provides a number of additional methods and attributes that can be used to operate on geodata within a DataFrame.
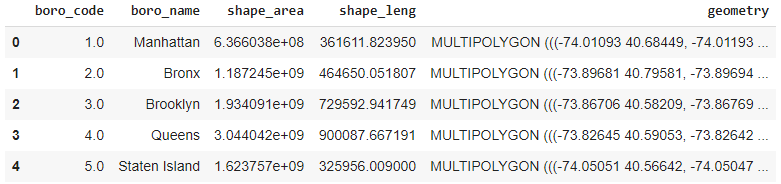
A GeoDataFrame is nothing but a regular Pandas DataFrame with an extra ‘geometry’ column for every row that captures the location data.
Geopandas can also conveniently load geospatial data from all of these different geo file formats into a GeoDataFrame with a single command. We can perform operations on this GeoDataFrame in the same way regardless of the source format. This abstracts away all of the differences between these formats and their data structures.
Pre-processing geodata (Coordinate Reference Systems)
Our geodata contains (x, y) coordinates of geographical locations usually as latitude and longitude numbers. However, oddly enough, just by themselves, those coordinates cannot be mapped to a physical location.
Those coordinates are just numbers in an arbitrary space. For them to uniquely map to an actual place in the real world, they must be associated with a coordinate system, known as a CRS.
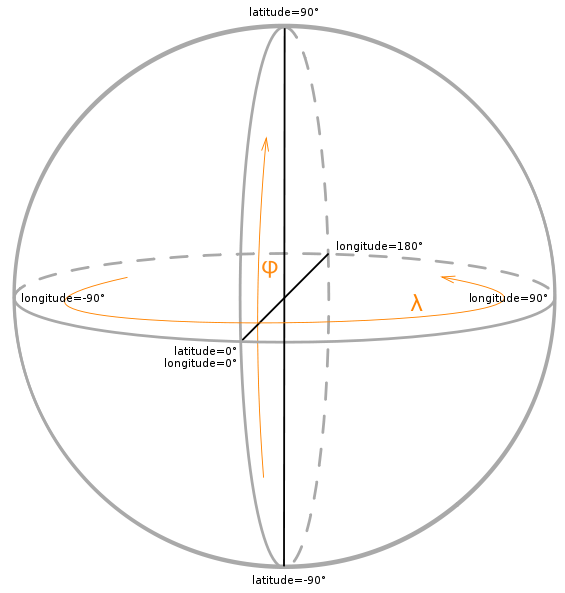 Coordinate Reference Systems map Lat/Long coordinates to an actual spot on the Earth (Source)
For our purposes, it is enough to know that, because our earth is not a perfect sphere, there is no one perfect universal CRS. We have many different CRSs, each optimized for specific purposes or different regions of the globe.
Pre-processing geodata (Map Projections)
Similarly, the CRS is used to project the location coordinates onto a map for visualization.
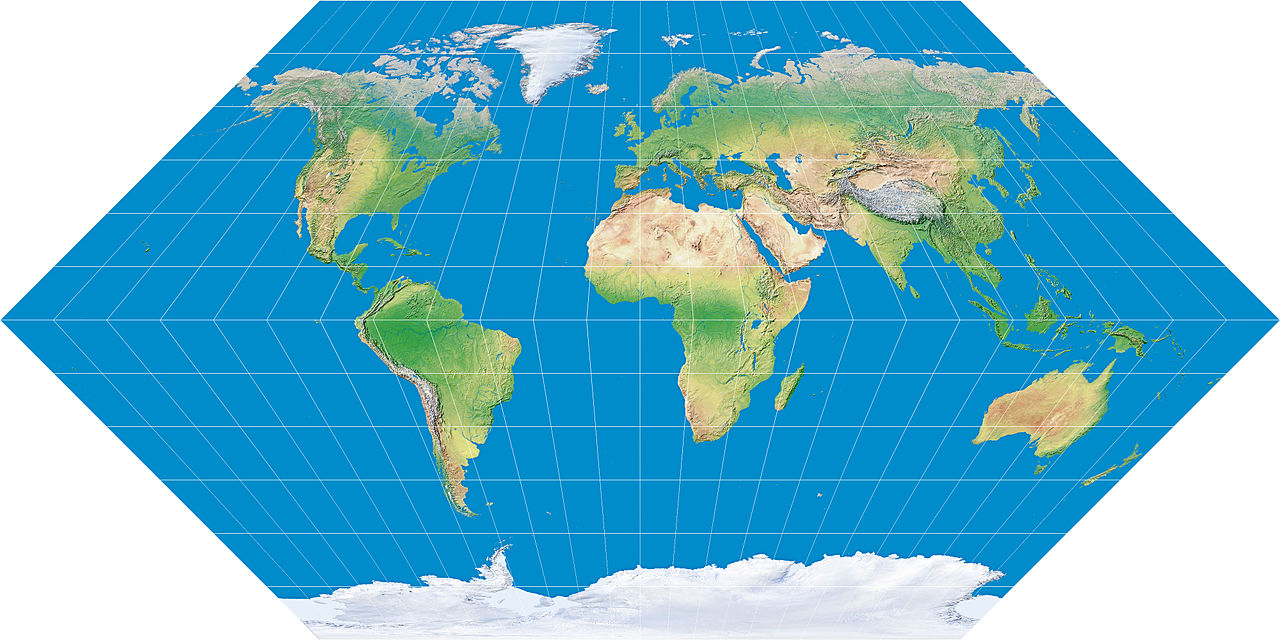 Map Projections show a 3D sphere on a 2D surface (Source)
Therefore, if you obtain geodata from different sources, you must take care to re-project all those coordinates onto the same CRS. And also make sure that it matches the CRS used by the visualization map. Otherwise, your location coordinates will not be aligned correctly.
After loading and standardizing the geodata, you would want to perform exploratory data analysis and visualize your data.
Visualization
Geopandas has good built-in plotting functionality. Also, there a number of excellent Python libraries to visualize geodata such as Folium and Plotly.
Load your application data into a Pandas Dataframe.
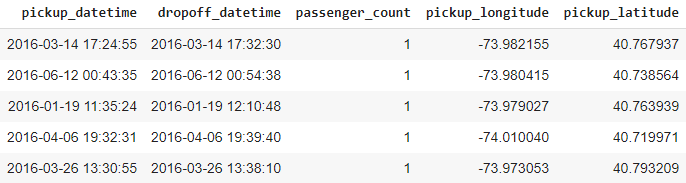
Convert it to a GeoDataFrame by transforming the location information into its geometry format.
And then plot the GeoDataFrame.
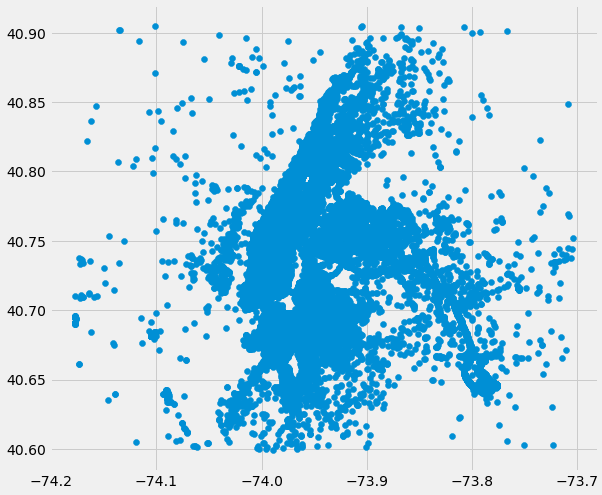 The plot of location data (Image by Author)
By themselves, the data points do not carry enough context. Since these are locations in New York City, you must overlay them on a base map of New York (which we had loaded from a Shapefile) to make it meaningful.
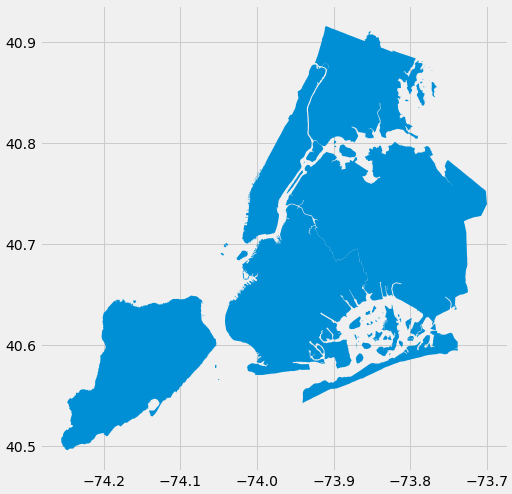 Base map of New York City (Image by Author)
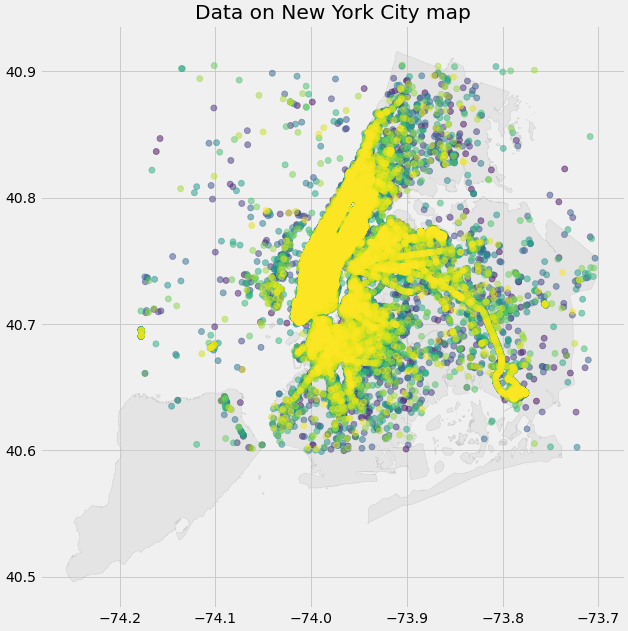 Overlay the location data on the base map for context (Image by Author)
Feature Engineering
Depending on the problem you want to solve you can use the location data to add more features to your dataset. Here are a few that are commonly used:
Geocoding and Reverse Geocoding
Geocoding is how you map a text address (of the house you’re trying to price, for instance) to location Lat/Long coordinates. Conversely, reverse geocoding maps coordinates to an address with information like a street address, city, state, and zip code. Geopy is a popular Python library that provides functionality to do this.
Distance between two points
Once you have the exact location coordinates of places of interest, you could compute the distance between them. For instance, the distance to the nearest hospital might be a useful criterion. Or the distance between the pickup and dropoff locations for a taxi-sharing problem. There are several different ways to measure this distance.
- Euclidean distance is a simple straight-line distance between (x, y) coordinates of two points. This distance is measured on a flat 2D surface.
- Geodesic distance, on the other hand, is measured on a spherical Earth on a 3D surface. eg. Great-circle distance is the shortest distance between two points on a sphere. Alternately, Haversine distance is similar in concept to Great-circle but uses the Haversine formula instead
- Manhattan distance is relevant to city locations, where streets might have a grid layout. It is intended to calculate the actual travel distance (say, driving or walking) between two points along city streets, as that might be more relevant than the physical distance “as the crow flies”. Its name comes from computing distances in Manhattan in New York where everything is laid out in square city blocks with roads running parallel to each other and intersecting at right angles. However in practice, even though they run straight, streets aren’t always aligned in a north-south and east-west direction. So it accounts for this and computes the corrected distance based on the angle of rotation of the city street map.
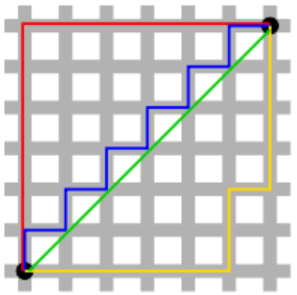 Manhattan Distance (Source)
Bearing of one point to another
When traveling between two places on the globe, in addition to the distance you can compute the direction of travel. The bearing computes the initial direction when you head out from the starting point.
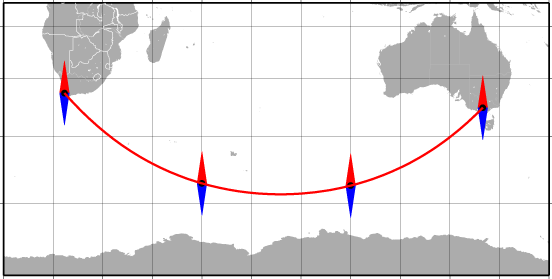 Bearing between Cape Town and Melbourne (Source)
Distance from a point to a line
This is another useful data point that you might need to capture. For example, how far is a house from a highway, a railway track, or a bus route? Or how far is a farm from a river?
Containment
Besides point locations, you might have places of interest that are regions. You might want to know whether a point is within a particular region.
For instance, whether a house lies within a highly-rated school district as that significantly influences its value.
Overlap between regions
The overlap can be measured based on the intersection or union between two regions. For example, whether a flood zone (or forest area) overlaps with a county or state.
Geographical Clustering
This helps you group together locations in geographical clusters, that may not be aligned with existing geographical state or country boundaries.
For a customer segmentation application, for instance, you could identify clusters based on customer location and create a feature that assigns each customer to a cluster.
Another example might be clusters based on locations of Covid-infected patients to trace the spread of the disease.
Geographical Area Embeddings
Just like we use word embeddings for textual data, a deep learning model could potentially learn location-based embeddings for geographical areas. For instance, embeddings based on postal code or county name could be leveraged to capture feature patterns that distinguish each such area.
Machine Learning Models
As we’ve just seen geo-location data and its related features can be structured as regular tabular data with numerical or categorical variables. For instance, geo data along with newly engineered location features about a house would be used alongside all the other (non-location) attributes such as its age and square footage.
This means that dealing with location data is mostly about data preparation rather than about building any location-specific machine learning or deep learning models. You would continue to use the same models that are typically used for tabular data.
Note that Lat/Long coordinates can often be used as-is with tree-based models like Random Forest or Gradient Boost that do not require data to be normalized. Other models such as neural network models would usually require those coordinates to be normalized.
Conclusion
With GPS data of mobile phones, it is now possible to capture, track and analyze the locations and movements of people like never before. This opens up a plethora of fascinating applications that rely on understanding location data.
This article gives us a high-level picture of the landscape for dealing with geo-location data. It puts us in a good position to go deeper into some of these topics in later articles.
Let’s keep learning!